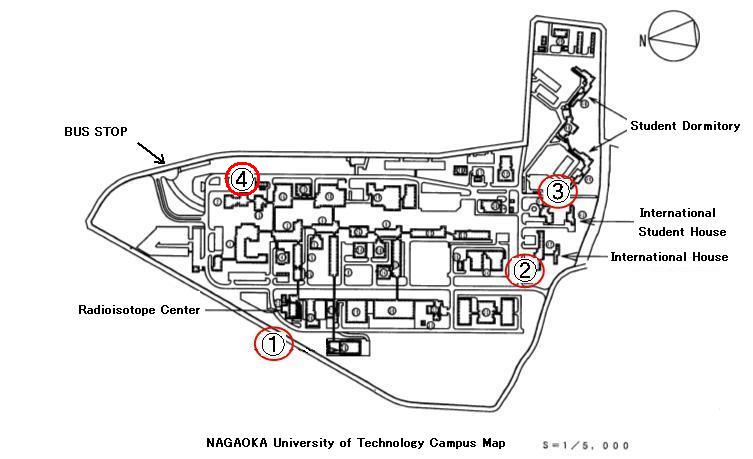
The radiation dose rates are monitored everyday at the following spots
①, ②, ③ and ④ at Nagaoka University of Technology.
*The readings at point ④ are measured by pocket dosimeter. (average dose
per hour)
Since April 11, we have reported only the pocket dosimeter readings at
point ④, since all the values determined at the four points so far have
been similar and lower than usual levels.
|
 |
Radiation dose rates (microsieverts per hour)
The table indicates radiation dose rates in air at the spots, and the values are shown as microsieverts/hour (μSv/h).
The recommended maximum radiation dose rate in a place of daily life is
250 μSv/3 months.
|
 |
| Date |
Point ① |
Point ② |
Point ③ |
Point ④ |
6/1 14:00
|
- |
- |
- |
0.04 |
6/2 14:00
|
- |
- |
- |
0.08 |
6/3 14:00
|
- |
- |
- |
0.08 |
6/4 14:00
|
- |
- |
- |
0.04 |
6/5 14:00
|
- |
- |
- |
0.08 |
6/6 14:00
|
- |
- |
- |
0.04 |
6/7 14:00
|
- |
- |
- |
0.08 |
6/8 14:00
|
- |
- |
- |
0.08 |
6/9 14:00
|
- |
- |
- |
0.08 |
6/10 14:00
|
- |
- |
- |
0.08 |
6/11 14:00
|
- |
- |
- |
0.08 |
6/12 14:00
|
- |
- |
- |
0.04 |
6/13 14:00
|
- |
- |
- |
0.08 |
6/14 14:00
|
- |
- |
- |
0.08 |
6/15 14:00
|
- |
- |
- |
0.08 |
6/16 14:00
|
- |
- |
- |
0.04 |
6/17 14:00
|
- |
- |
- |
0.08 |
6/18 14:00
|
- |
- |
- |
0.04 |
6/19 14:00
|
- |
- |
- |
0.08 |
6/20 14:00
|
- |
- |
- |
0.08 |
6/21 14:00
|
- |
- |
- |
0.08 |
6/22 14:00
|
- |
- |
- |
0.04 |
6/23 14:00
|
- |
- |
- |
0.08 |
6/24 14:00
|
- |
- |
- |
0.08 |
6/25 14:00
|
- |
- |
- |
0.08 |
6/26 14:00
|
- |
- |
- |
0.04 |
6/27 14:00
|
- |
- |
- |
0.08 |
6/28 14:00
|
- |
- |
- |
0.04 |
6/29 14:00
|
- |
- |
- |
0.08 |
6/30 14:00
|
- |
- |
- |
0.04 |
|
Usual levels measured are between 0.05-0.07 μSv/h.
Usual levels measured with the pocket dosimeter are between 0.04-0.08 μSv/h. |
Previous Month   Next Month Next Month |

